SPSS统计分析(九)交叉表分析
SPSS统计分析(九)交叉表分析
SPSS统计分析(九)交叉表分析
SPSS statistical analysis (IX) cross table analysis

在实际分析过程中,经常需要分析多个变量之间,一个变量是否对其他变量的取值存在影响,分析变量之间是否存在关系,这种分析就叫做交叉表分析。
In the actual analysis process, it is often necessary to analyze multiple variables, whether one variable has an impact on the value of other variables, and whether there is a relationship between variables. This analysis is called cross table analysis.
分析变量之间的关系时,经常分析变量之间的相关程度。对于数值型的变量分析其相关性通常是通过计算相关系数或者进行回归分析。对于定类型变量,则通常采用交叉表进行分析。
When analyzing the relationship between variables, the degree of correlation between variables is often analyzed. For numerical variable analysis, the correlation is usually calculated by correlation coefficient or regression analysis. For variables of fixed type, the cross table is usually used for analysis.
交叉表是两个或者多个变量交叉分组之后形成的频数分布表,交叉表分析中的相关关系的检验方法主要有卡方统计检验和相关性检验。
Cross table is a frequency distribution table formed after two or more variables are cross grouped. The test methods of correlation in cross table analysis mainly include chi square statistical test and correlation test.
SPSS实例分析:
SPSS case analysis:
1
(1) 数据组织:在数据文件中建立两个变量:“实验准备”、“评价结果”,两个变量均为数值型或者字符型的定类变量,其度量标准为“名义”。
(1) Data organization: establish two variables in the data file: "experimental preparation" and "evaluation result". Both variables are fixed variables of numerical or character type, and their measurement standard is "nominal".

2
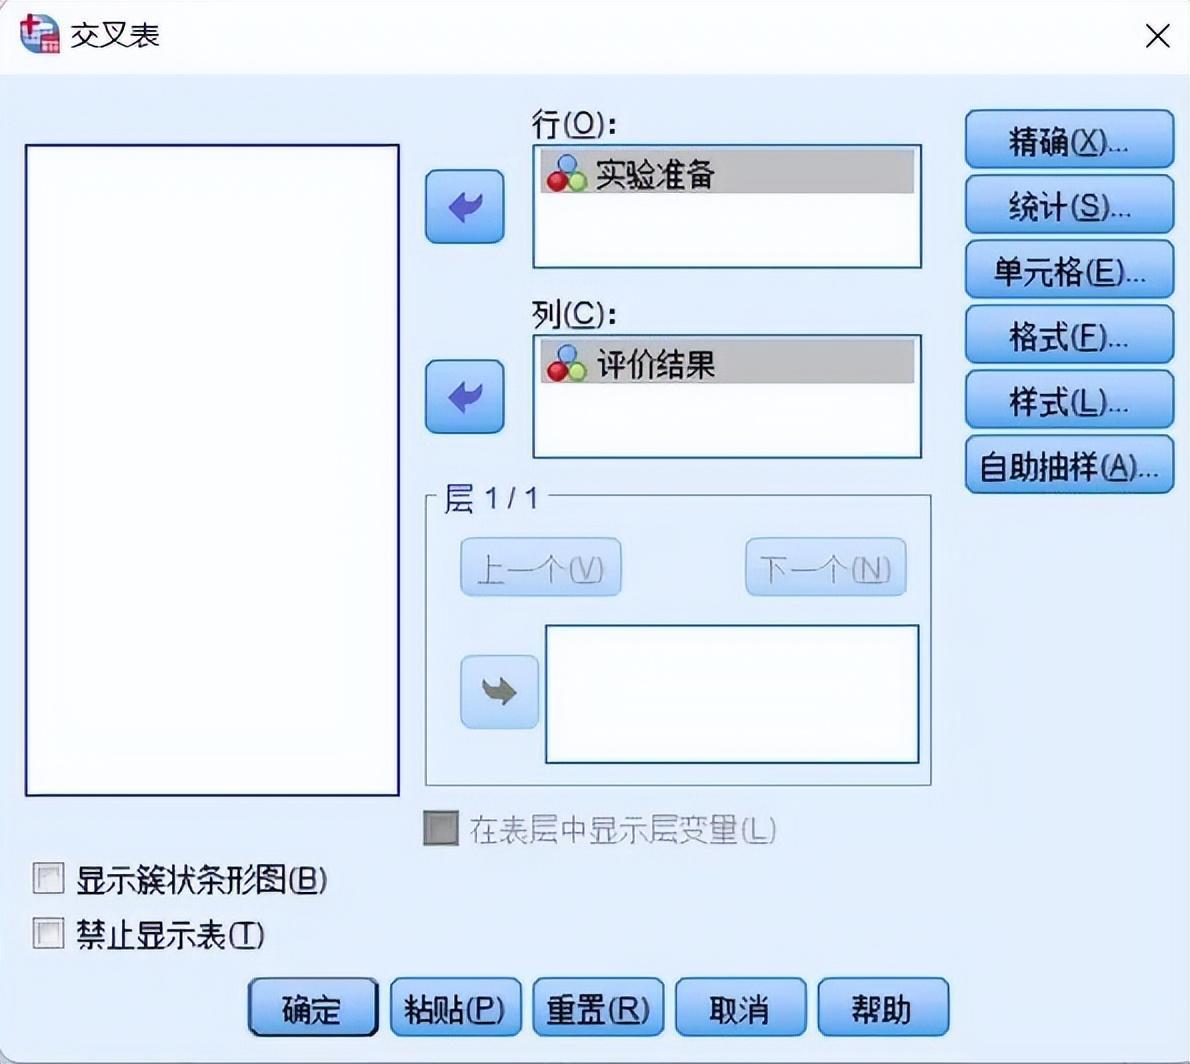
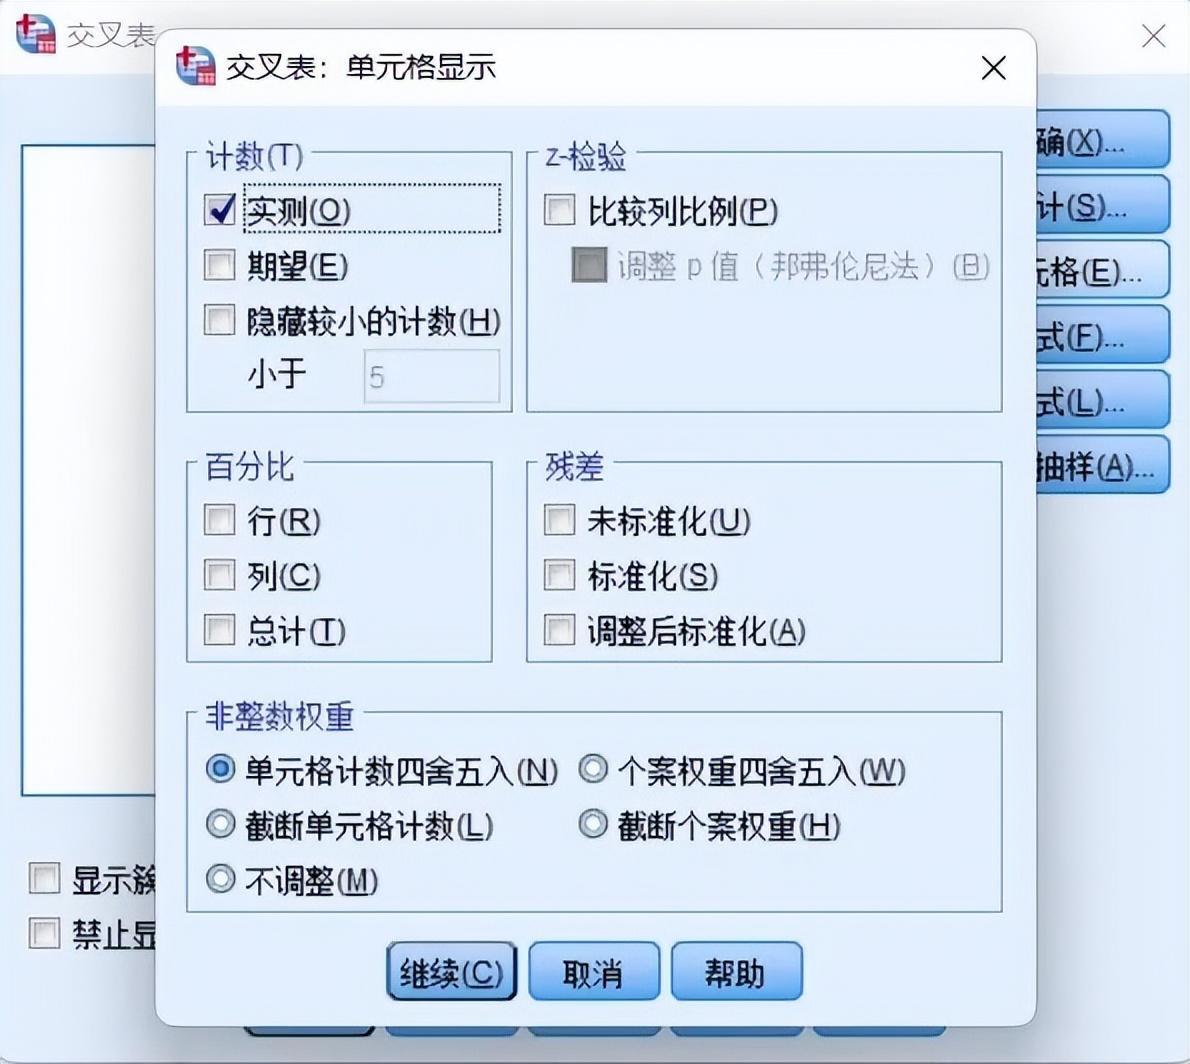
(2) 交叉表分析设置:如下图所示。
(2) Crosstab analysis settings: as shown in the following figure.


3
(3) 主要结果及分析:
(3) Main results and analysis:
1. 个案处理摘要 Summary of case handling

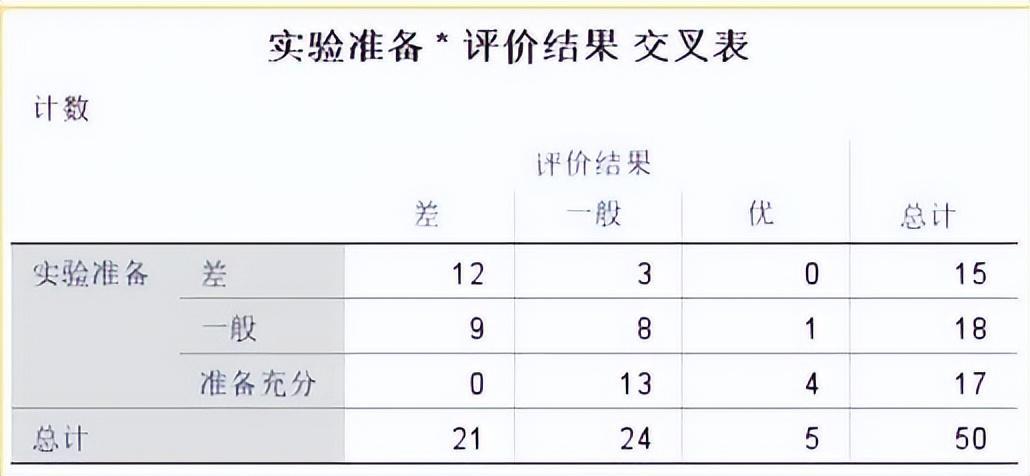
2. 交叉表 Cross table
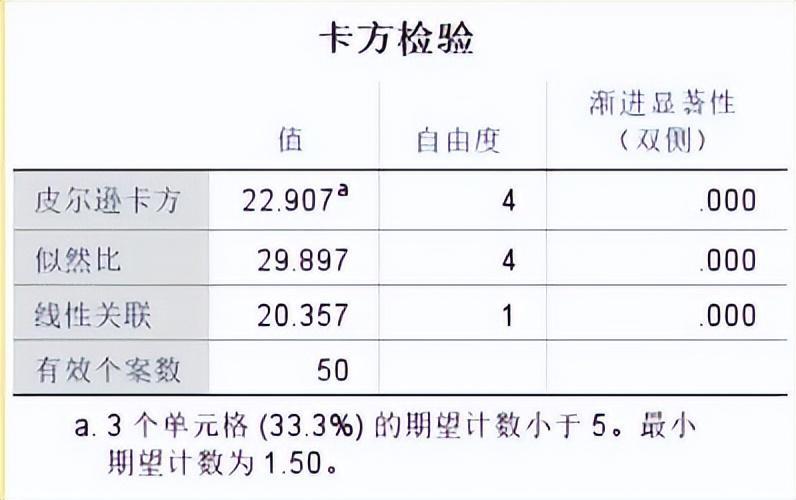
3. 卡方检验结果 Chi square test results
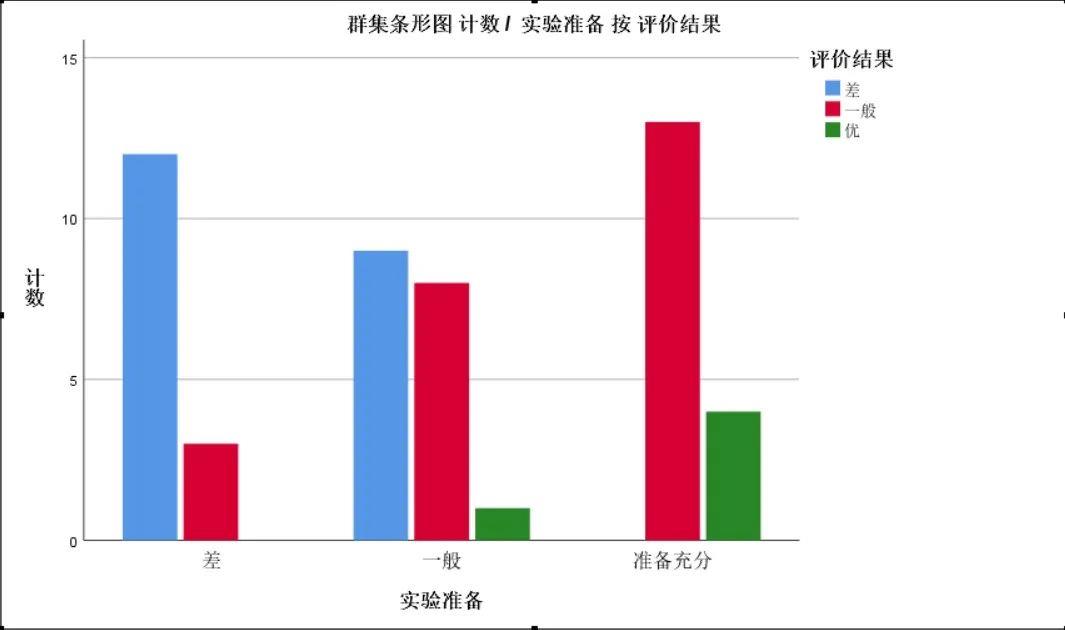
4. 条形图 Bar chart
参考资料:百度百科、《SPSS 23统计分析实用教程》
翻译:百度翻译
本文由LearningYard新学苑原创,部分文字图片来源于他处,如有侵权,请联系删除。
标签:


